MEDA DATABASE ON TRANSBOUNBDARY AQUIFERS Version 2.1 23/08/07
(ESCWA-UNESCO-UNECA-UNECE)
QUESTIONNAIRE
ON TRANSBOUNDARY AQUIFERS IN THE MEDA REGION
Please complete using Word document format.
Please complete a separate
questionnaire for each aquifer
Please return by e-mail to: al-mooji@un.org and R.Stephan@unesco.org with copies to: iganouli@civil.auth.gr
and a.aureli@unesco.org, by 31st August
2007.
1. NAME
OF THE TRANSBOUNDARY AQUIFER, LOCATION & COUNTRIES
Please give the name(s) or other identification property of the shared
aquifer, its approximate location
(province, department) and say which countries share it.
Helvetien - Eocen Aquifer –Ras El Ain,located at the border between
2. AQUIFER
CHARACTERISTICS
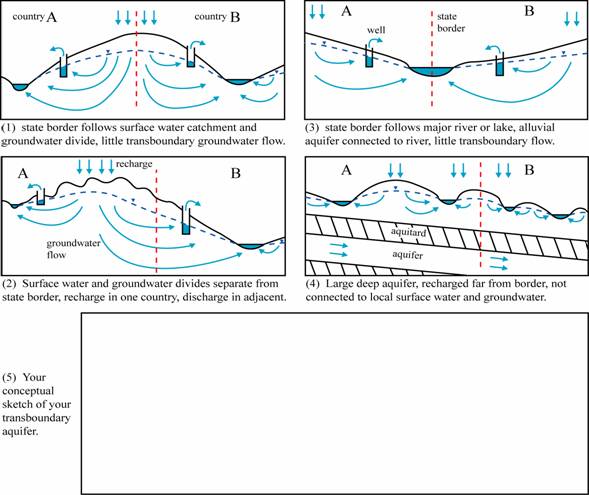
2. 1 Please look at the four simplified pictures below and indicate which of them most
closely characterises your transboundary aquifer. If none, please provide a
conceptual sketch of your transboundary aquifer in the blank box below.
Please tick: Example 1 2 3 4 5
2.2 General
Characteristics
Aquifer hydrogeological type porous
karstic
fissured rock other
Predominant lithology.......Limeston ...........................................................................................……….
Stratigraphic age
Helvetien-Eocen………………………………………………………………………………….
Areal extent (km2)..3600...................Population resident in this area and main occupation…one million Agriculture……………
Thickness: mean
(m).150............ maximum (m)...500............
Shared international boundary length
(km)…130km …………………………
Dominant groundwater flow direction: from..
Link with surface water systems: strong
medium
weak
2.3 Map
Please provide
a clear map of the transboundary aquifer, including aquifer boundaries and
geographical coordinates. The map should preferably be supplied as
a GIS-file
2.4 Hydrogeological
Characteristics and Groundwater Use
Rainfall: average annual and seasonal distribution …400mm …the
precipitation period is from November to April………………………………
Recharge / discharge area…Aquifer is
recharged mainly by infiltration from precipitation in
Level changes
(m/yr) – natural, induced by pumping, or other reasons…between 2.4 to 6 m (
between maximum and minimum )………………………
Total
available non- renewable
groundwater reserves (Mm3/yr): ……………………
Total available annually renewable groundwater resources (Mm3/yr):…1800…
Total groundwater abstractions (Mm3/yr)
(estimated where not measured) …1.600……………………
Flow in/out across national boundary
(Mm3/yr)…1800…………………………….
Groundwater flow direction and gradient
across boundary…N-S………………………………..
Water uses (total, by sector, principal uses, current - estimated and future - projected)……1600 as total ,1300 for
agriculture …………………….
Deficits and other resource concerns
(e.g. quality, extremes, environmental degradation, interactions with surface
water bodies / other aquifers)…the spring stopped to flow
,and local land subsidence …the aquifer
is vulnerable to pollution from fertelizers.………………………………….
3. MONITORING DATA
Please note that stakeholders should
comply with the WMO Resolution 25 on international exchange of hydrological and related data. (http://www.wmo.ch/index-en.html). If appropriate insert Excel tables into the
Word document in order to provide information and available data on quantity, quality and accessibility,
including:
·
Observation networks
·
Maps, with available scales, GIS and remote sensing imagery
·
Type of data and monitoring equipment
·
Data archives and their adequacy
·
Institutions in charge
·
Research centres
3.1 Quantity
·
No. of monitoring stations
·
Frequency of measurements
·
Water levels
·
Additional information
3.2 Quality
·
No. of monitoring sites
·
Frequency of measurements
·
Nitrogen compounds
·
Salinity and major ions
·
Heavy metals
·
Pesticides
·
Industrial organic compounds
4. IMPORTANCE OF TRANSBOUNDARY GROUNDWATERS
Uses and Functions
Does
the groundwater in this transboundary aquifer have direct uses and/or other
functions?
No Why
not? Irrelevant
groundwater resource
Problems with groundwater
(if yes, indicate these in section 5)
or:
Yes Uses Shared
Aquifer Groundwater as % of total water use in the area 90%
Total Shared Groundwater as % of
total water use 20%
Total Groundwater as % of total
water use
…
Other functions Support of ecosystems
Support of agriculture
(directly from shallow
water table)
Preventing land subsidence
Maintaining baseflow and springs
Seasonal
heatstorage
Any
other function
(please specify)
Groundwater abstraction
and use in the aquifer
Indicate in the table the
percentage of total groundwater abstraction accounted for by each use
|
Type
of use |
Percentage |
If
you do not know the exact percentage, than mark one of the following options |
|||
|
< 25 % |
25 – 50 % |
50 – 75 % |
> 75 % |
||
|
Drinking water |
|
+ |
|
|
|
|
Irrigation |
|
|
|
|
+ |
|
Industry |
|
|
|
|
|
|
Mining |
|
|
|
|
|
|
Thermal spa |
|
|
|
|
|
|
Livestock |
|
|
|
|
|
|
Other
(please specify) |
|||||
|
|
|
|
|
|
|
|
|
|
|
|
|
|
Please indicate the year to which these figures apply....2002............
5. WHICH PROBLEMS
ARE OBSERVED IN TRANSBOUNDARY GROUNDWATERS?
5.1 Problems
related to groundwater quantity
a) Specify if possible the average trend of
groundwater level decline (m/year) ...2-4...............
b) Indicate
in the table the type and scale of problem associated with groundwater
abstraction from the aquifer
|
Problem |
|
|||
|
1. Local and moderate |
2.
Local but severe |
3.
Widespread but moderate |
4.
Widespread and severe |
|
|
Increased
pumping lifts or costs |
|
+ |
|
|
|
Reduction
of borehole yields |
|
+ |
|
|
|
Reduced
baseflow and springflow |
|
+ |
|
+ |
|
Degradation
of ecosystems |
|
+ |
|
|
|
Sea
water intrusion |
|
|
|
|
|
Salt
water upconing/downconing |
|
|
|
|
|
Polluted
water drawn into aquifer |
|
|
|
|
|
Land
subsidence |
|
+ |
|
|
|
Other
(please specify) |
||||
|
|
|
|
|
|
|
|
|
|
|
|
5.2 Problems related to groundwater quality
Indicate in the table the
type, nature and scale of groundwater quality problems in the aquifer
|
Problem |
Nature of problem |
Typical range of concentrations |
Scale, using classes 1-4 from table above |
|
|
Natural origins |
From human activities |
|||
|
Salinisation |
|
|
|
|
|
Nitrogen
species |
|
|
|
|
|
Pesticides |
|
|
|
|
|
Heavy
metals |
|
|
|
|
|
Pathogens |
|
|
|
|
|
Industrial
organic compounds |
|
|
|
|
|
Hydrocarbons |
|
|
|
|
|
Other
(please specify) |
||||
|
|
|
|
|
|
|
|
|
|
|
|
5.3 Evidence
for transboundary effects
a)
Do you observe any decline of groundwater levels (or
piezometric levels) caused or probably caused by activities in neighbouring
countries?
Yes No
b)
Do you observe any groundwater pollution caused or probably
caused by activities in neighbouring countries?
Yes No
6. TRANSBOUNDARY
MANAGEMENT MEASURES
Indicate in the table which measures are presently being
implemented or need to be applied
|
Management Measures |
Already used and effective |
Used, but Need to be improved |
Need to be applied |
Currently planned |
|
Transboundary
institutions (commissions, agreements, treaties, etc.) |
|
|
+ |
|
|
Groundwater
abstraction management by regulation (licensing, taxation) |
|
+ |
|
|
|
Groundwater
abstraction management by incentives or disincentives (subsidies, credits,
energy prices, energy supply, etc.) |
+ |
|
|
|
|
Increasing
efficiency of groundwater use |
|
+ |
|
|
|
Monitoring
of groundwater quantity |
|
+ |
|
|
|
Monitoring
of groundwater quality |
|
|
+ |
|
|
Public
awareness campaigns |
|
|
+ |
|
|
Protection
zones for public supplies |
|
|
+ |
|
|
Vulnerability
mapping for land use planning |
|
|
+ |
|
|
Good
agricultural practices |
|
|
+ |
|
|
Groundwater
integrated into river basin management |
|
|
|
|
|
Wastewater
reuse or artificial recharge |
|
|
|
|
|
Treatment
of urban wastewater |
|
|
|
|
|
Treatment
of industrial effluents |
|
|
|
|
|
Exchange
of data between countries |
|
|
+ |
|
|
Other
(please specify) |
||||
|
|
|
|
|
|
|
|
|
|
|
|
|
|
|
|
|
|
7. POLICY AND LEGISLATIVE PROPERTIES
- Does your country have domestic
legislation on water resources ?Yes In particular, does this legislation
include a part on groundwater resources,Yes or is there a separate
groundwater legislation? NO Could you give an indication of the main
provisions concerning groundwater, such as abstraction, licensing,
pollution prevention zoning mechanisms etc.
- What is the governmental
institutional set-up for water management in your country, at national and
sub-national level? Ministry of irrigation at the National level and
Directorate of water resources management at local level(Give full name of
institution(s), and a brief description of the relevant internal structure
and mandate). Is there any specific government institution for groundwater
management? No
- Are there any arrangements or
agreements with your neighboring States regarding the transboundary
aquifers ? Is there any form of cooperation with the neighboring States on
the transboundary aquifers? NO
8. NAME AND CONTACT DETAILS OF PERSON(S) COMPLETING THIS FORM:
Name……Abdullah
Droubi…………………………………………………………………………
Institution…ACSAD………………………………………………………………………
Address……………………………………………………………………………
……………………………………………………………………………………..
Tel………………..Fax………………E-mail
droubi@scs-net.org…………………………………..